
Product update Attribution 2.0
Introducing Align.ly Attribution 2.0
More flexible dashboards, deeper analysis, and clearer buying journey insights. All within Salesforce.
Go-to-market attribution should help you make better decisions. Which campaigns are creating pipeline? Where are prospects dropping out? What touches help move an opportunity forward?
The answers become more useful when you can explore them by audience, compare performance over time, and see the activity behind the numbers.
Today, we’re introducing Align.ly Attribution 2.0, a major update that brings more flexible dashboards, deeper analysis, and clearer buying journey insights directly into Salesforce.
Built on the same 100% native Salesforce foundation, Attribution 2.0 gives you more control over how you measure go-to-market performance and understand its contribution to pipeline and revenue.
Your Dashboard. Your Funnel. Your Questions.
Every business measures its funnel differently. Your reporting should reflect how your team works.
Custom Dashboard Engine
Our new dashboard engine brings funnel reporting, multi-touch attribution, trending charts, and buying journey insights together in Salesforce. Build a clearer picture of performance, then explore the questions that matter to your business.
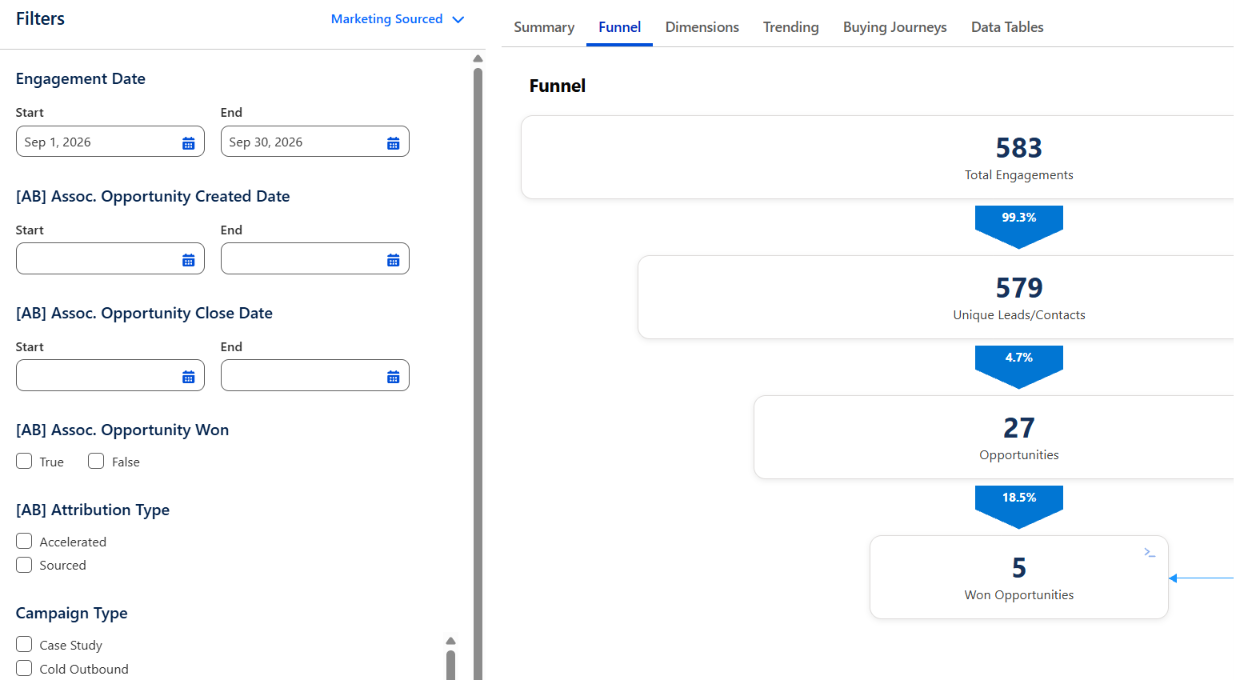
Configurable Filters
Focus your analysis with configurable filters. Narrow your view to the records and segments you want to understand, and explore how performance changes across different parts of your business.
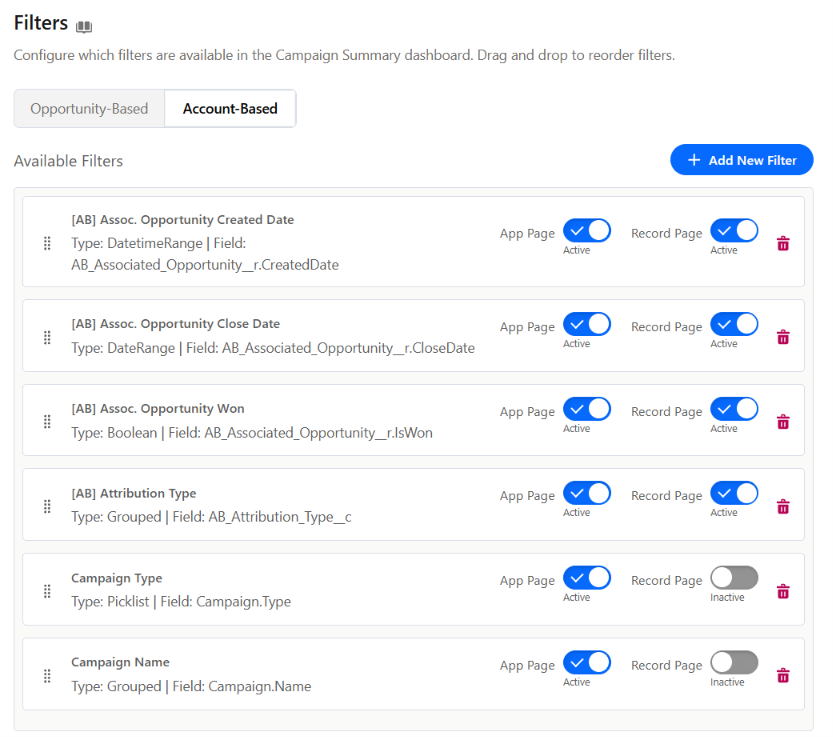
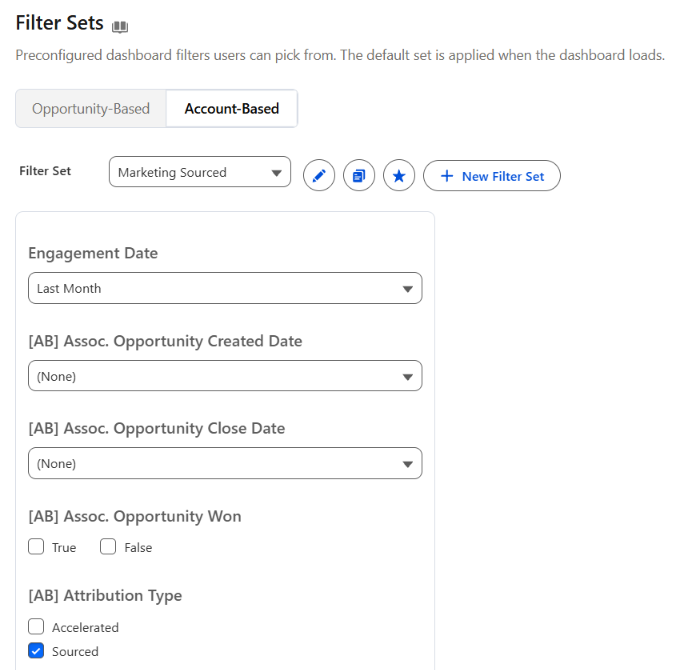
Pre-defined Filter Sets
Make the views your team uses regularly easier to revisit. Pre-defined filter sets give users a consistent starting point for analysis and reduce the work of applying the same filters each time.
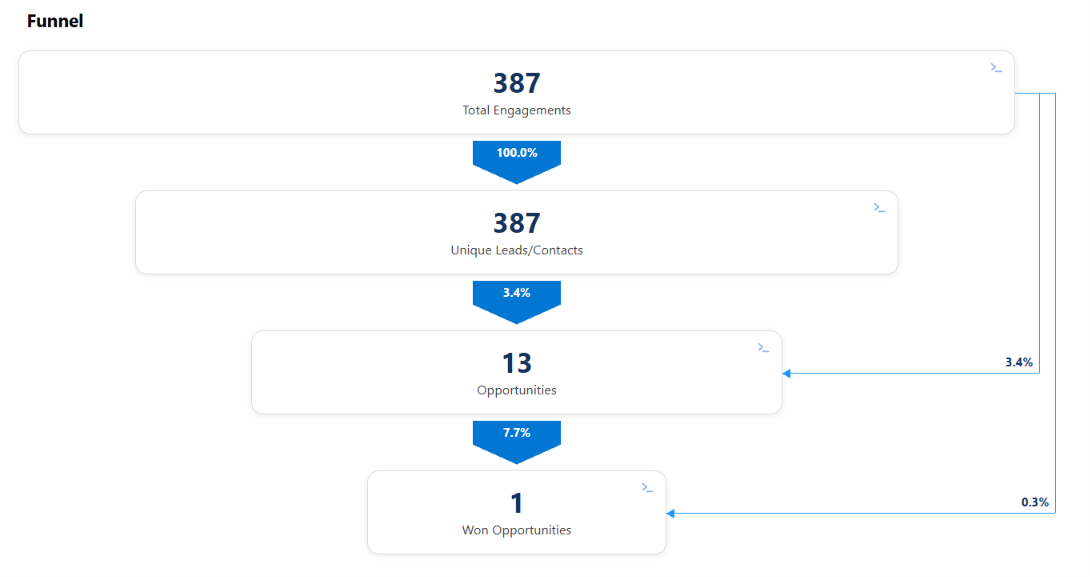
Customizable Funnels
Define a funnel that reflects your go-to-market process. Measure progression through the stages that matter to your business, understand conversion rates, and identify where prospects lose momentum.
Understand What Drives Pipeline and Revenue
Knowing how much pipeline your go-to-market activities influenced is useful. Understanding which activities contributed, and how that varies across your business, helps you decide what to do next.
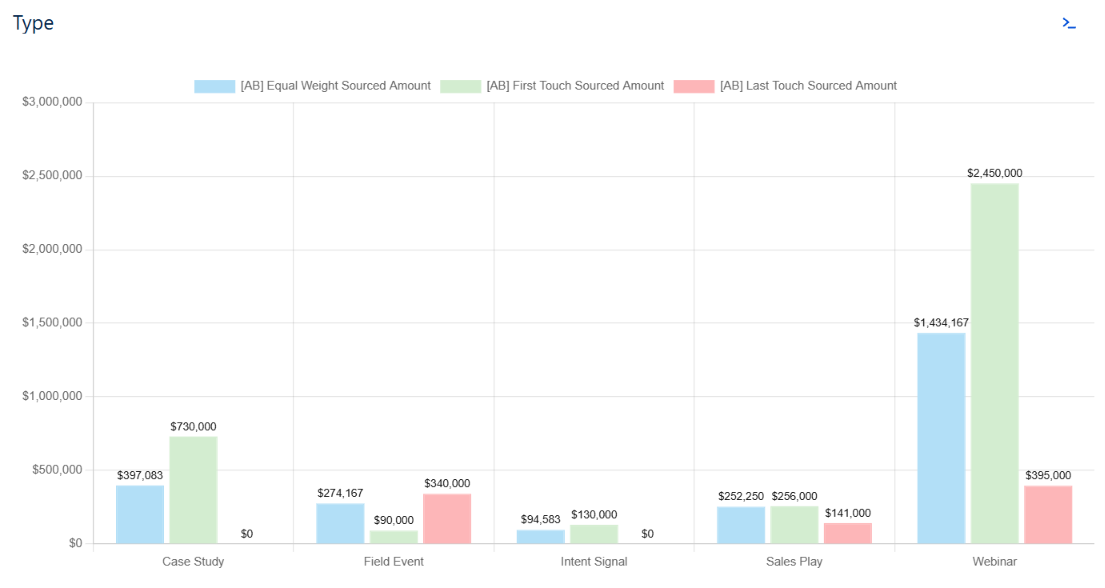
Multi-touch Attribution by Dimensions
Explore attribution across the dimensions that matter to your reporting. Compare how different groups of campaigns and touchpoints contribute to pipeline and revenue, and uncover differences that an overall total can hide.
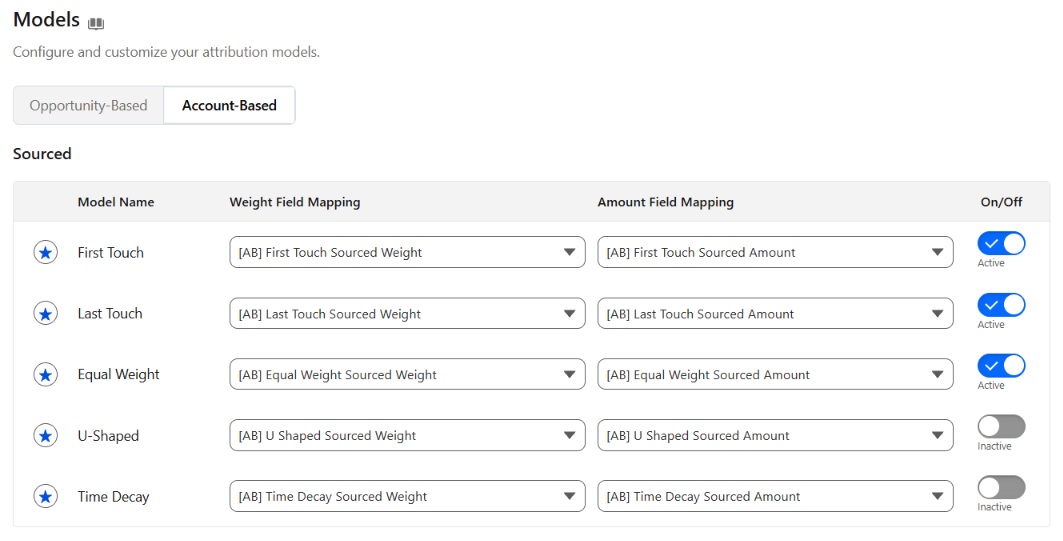
Attribution 2.0 builds on Align.ly’s support for account-based and opportunity-based attribution, with First Touch, Last Touch, Equal Weight, U-Shaped, and Time Decay models, plus support for Custom Weighted Models.
Together, these perspectives help you understand which activities source opportunities, accelerate open pipeline, and influence revenue.
Custom Weighted Models
Align.ly now supports Custom Weighted Models, giving you more control over how attribution credit is distributed. Define weights that reflect how your business evaluates contribution to pipeline and revenue.

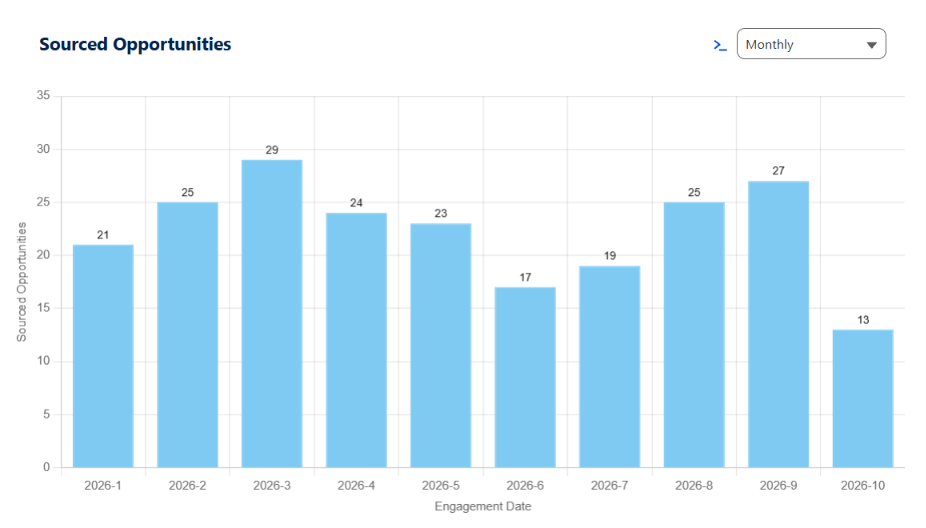
Trending Charts
See how performance changes over time. Trending charts help you spot patterns, compare periods, and understand whether your results are moving in the right direction.
Use those trends to bring context to your reporting and guide your next set of questions.
Explore the Journey Behind the Numbers
A dashboard can show you an outcome. The activity behind that outcome helps explain how it happened.
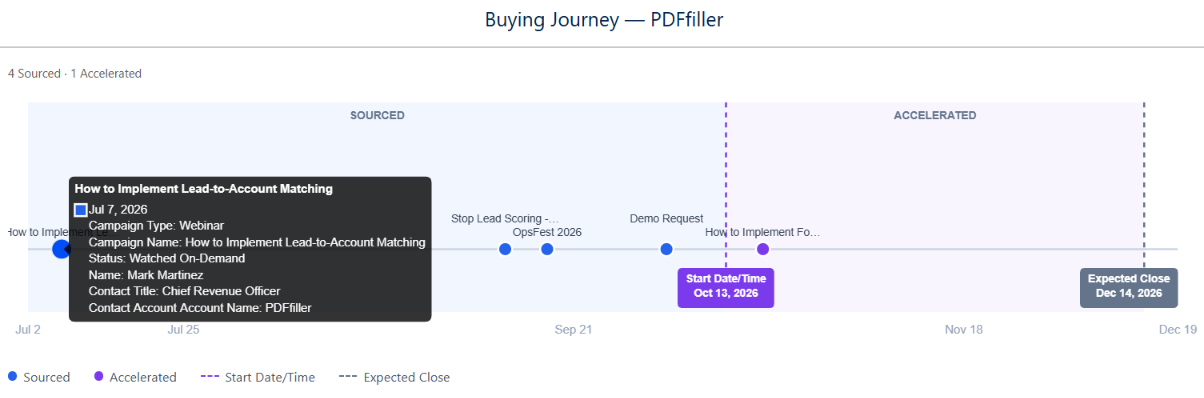
Buying Journeys
Bring campaign touchpoints into the context of an opportunity’s buying journey. See engagement before the opportunity was created and during the sales cycle to better understand your go-to-market activities’ role throughout the process.
Buying Journeys gives marketing and sales a shared view of the interactions that helped an opportunity progress.
Dashboard Drill-down
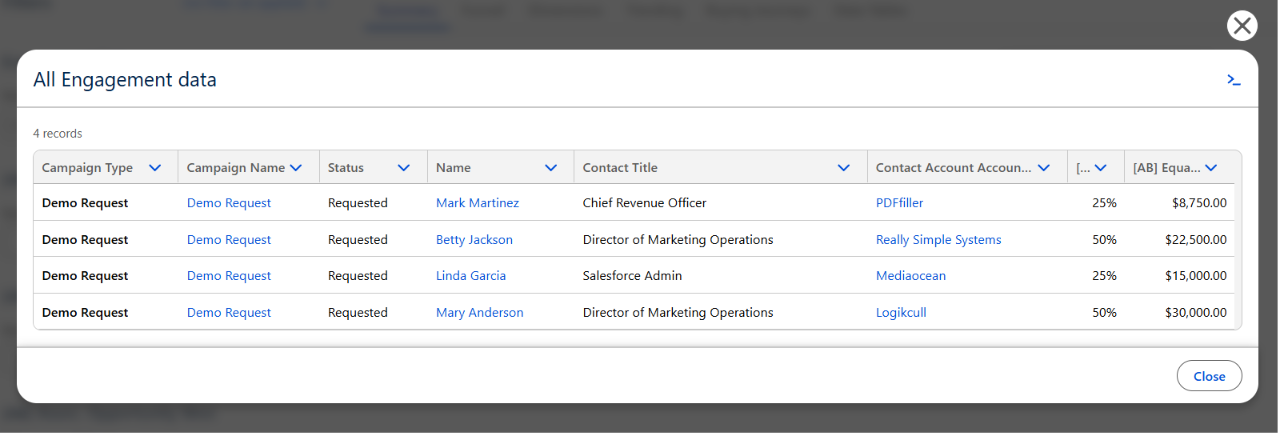
Move from a dashboard result to the records behind it. Drill-down makes it easier to investigate a number, understand what contributed to it, and follow up on what you find.
When a result raises a question, you can keep exploring.
A New Admin Experience
Attribution 2.0 also introduces a new admin experience for configuring and managing Align.ly Attribution.
As your reporting needs evolve, the admin experience gives you a clearer place to manage the setup supporting your attribution and dashboards.
Still 100% Native Salesforce
All of this builds on what makes Align.ly Attribution different:
- Your data stays in Salesforce. Attribution and reporting happen where your team already works.
- Salesforce Campaigns power your touchpoints. Build on the campaign data and processes you already use.
- Historical data puts attribution to work sooner. Backfill existing campaign data to understand past performance.
- Multiple attribution models give you perspective. Evaluate contribution through different lenses.
With Align.ly Attribution 2.0, you can move from a high-level result to a filtered view, a trend, or an individual buying journey, all within Salesforce.
See it in action
Ready to explore Align.ly Attribution 2.0?
Schedule a demo to see it in action.
Schedule a demo